
Swiss equities as substitutes for Swiss Government Bonds?

Dr. René Dubacher
Financial Markets
Swiss Government Bonds destroy capital over the next 10 years with guarantee
Swiss Government Bonds destroy capital over the next 10 years with guarantee
Swiss Government Bonds (also called Swiss Confederates in financial jargon) with a 10-year maturity have a yield to maturity of minus 0.3% at the end of 2018. For CHF 100 that I invest in this bond today, I will receive 97 Swiss francs in 10 years. This does not even take into account inflation, which is typically in the range of 1 to 2%. This nominal and real capital destruction is called financial repression by the central banks in the European context with good reason.
The Swiss blue chips, represented by the SMI, have a dividend yield of 3.6% (last 12 months); this with an expected dividend growth according to analyst estimates (source: Bloomberg) of 10%. For 100 francs invested in the SMI, I can expect a return of CHF 3.60 in the first year, in the next year this should be CHF 3.96, and so on. If the dividends would really grow by a high 10% p.a., we would receive CHF 57 in dividends over 10 years, with a growth of 5% still CHF 45 and with zero growth CHF 36.
This means that depending on the dividend growth rate, the Swiss stock market can decline by 60% (97-57), 46% (97-45) or by just under 40% (97-36) over the next 10 years and the expected total return (without reinvestment of dividends ) is still equal to that of the Swiss Confederation bonds.
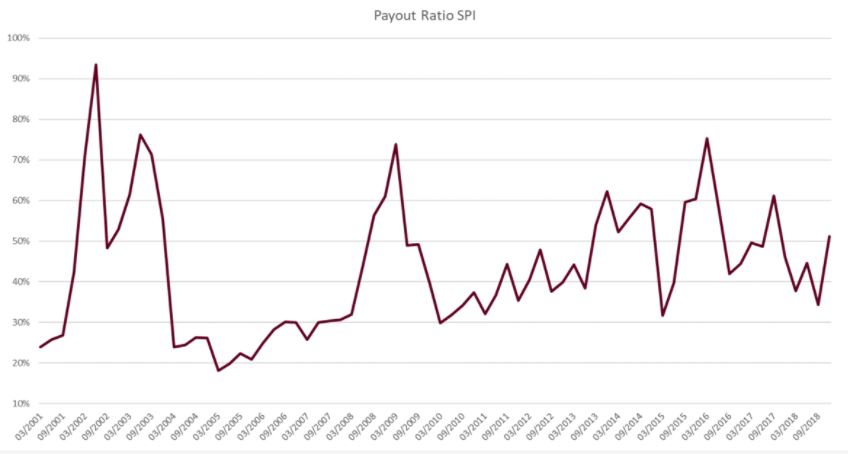
How realistic is 10% dividend growth? Since 2000, dividends of Swiss Performance Index stocks have actually grown almost 10% on a capitalization-weighted basis. At the same time, the payout ratio (the ratio of dividends paid out to a company's earnings) has risen from 20%-30% to 40%-60%.
Payout-Ratio Swiss Equities
Philip Straehl and Roger Ibbotson, in their article "The Long-Run Drivers of Stock Returns: Total Payouts and the Real Economy," examined the relevance of dividends and share repurchases on the total return of equity investments. They provide theoretical and empirical evidence for more than 140 years (period from 1871-2014). In doing so, they are able to show that total distributions (dividends plus buybacks = "total return") are the most important driver of long-term stock market returns. Further, they also show that total distributions per share (adjusted for buybacks) have grown in line with GDP.
For Switzerland, this means that the average nominal dividend growth of almost 10% over the past 15 years will hardly be realistic for the next decade. On the other hand, focusing only on Swiss GDP growth is not enough to assess the earnings performance of the many multinationals in the Swiss stock market. Global growth is estimated by the IMF at 2.5% in real terms over the next 5 years, with global inflation at 2%. For these reasons, dividend growth for Swiss equities of 4%-5% seems realistic.
Straehl and Ibbotson, following the Shiller P/E, also called "cyclically adjusted price-to-earnings ratio (CAPE)", develop a similar valuation measure based on total return, which they call "cyclically adjusted total yield (CATY)". They say it can show for the U.S. equity market that the cyclically adjusted total return predicts changes in the expected total return of the equity market at least as well as the cyclically adjusted PE ("CAPE").
The historical index time series of the UBS 100 Index, which is calculated with and without dividend reinvestment, allows us to make a long-term comparison of dividend yields over the past 30 years. As the following graph shows, the simple dividend yield has risen steadily, especially in the period after the financial crisis. In recent years, it has never been as high as it is today, and this in a period of negative interest rates and lowest inflation. Investor uncertainty still seems to be very high and the risk premium demanded higher than ever.

UBS 100 Dividend Yields
With a sufficiently long horizon, Swiss blue chips will beat the Swiss with a high degree of certainty
Bank Pictet calculates a historical stock index, which is available since 1926. With the help of this time series, the question can be answered how often the return of a broadly diversified stock portfolio --represented by the total market-- has realized a negative return at all. The answer is, there have been investment periods of 10 years with negative total returns including the reinvestment of dividends. Pictet names the periods 1929-1938, 1930-1939, and 1931-1940 as negative decades. All other ten-year periods (calendar years) have positive total returns.
Shiller as well as Straehl-Ibbotson were able to show that investors who invest in stocks during periods of moderate market valuation generate better returns over the longer term. Combine this knowledge with an investment horizon of 10 years, and equity investments are the choice of the hour. Long-term investors would do well to add to investments in stable Swiss blue chips.