
Swiss second-line stocks

Dr. René Dubacher
Financial Markets
We can observe large performance differences in the Swiss equity market: Depending on the capitalization segment, the performance deviations are untypically large
We can observe large performance differences in the Swiss equity market: Depending on the capitalization segment, the performance deviations are untypically large

Switzerland
The past quarter was a very good one for equity investors with a heavy exposure to Swiss stocks. The blue-chip SMI index has gained more than 13% since the end of 2018, while the 80 mid-cap stocks, represented by the SPI Mid Cap Index, realized almost the same performance with more than 13%. Far behind are the small-capitalization companies, which are grouped together in the SPI Small index: The 113 small caps have gained just 3.87% on an aggregate basis (including dividends) since December 31 of last year: a performance difference of almost 10%. Since January 2018, when the SPI Small Cap Index peaked, the record looks even bleaker. Small cap stocks are losing 16.5%, mid cap stocks are losing 6.4% and large cap stocks are gaining 6.28%. A performance difference from large to small of more than 20%.
The Swiss small caps, summarized in the SPIex index, have experienced a unique period of outperformance since the beginning of July 2013 until the end of July 2018. Relative to the SMI, this resulted in an outperformance of almost 70% or annualized 9%. The fact that a correction phase is occurring here is not really surprising.
However, the relative performance of mid-cap ("SMCI") and small-cap stocks ("SPI19") is different. These behave very similarly over longer periods, with the small-capitalization stocks showing a slightly better performance over the long term. This is no longer the case since the last financial crisis.
SPI Small and SPI Mid in comparison
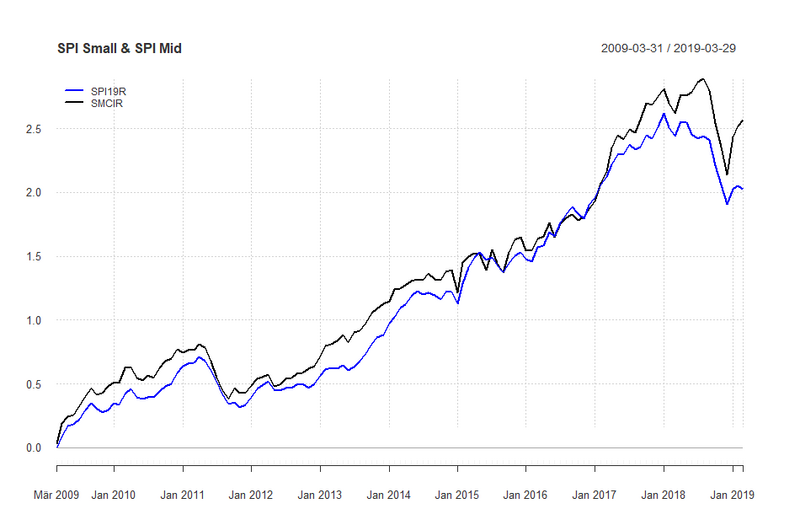
Switzerland SPI Small & SPI Mid
Since April 2017, however, small-cap stocks have underperformed by more than 17% cumulatively, a level not seen since the end of the 1990s.
The following graph shows the underperformance of small-capitalization stocks ("SPI19") relative to mid-capitalization stocks in the form of a "draw-down graph", i.e. a representation of the underperformance from a previous peak.

Switzerland Drawdown Small vs Mid
The small-capitalization stocks of the SPI have anticipated many of the negative events in the current year. We assume that the material situation is better than the bad sentiment priced in. Performance differentials in the capitalization segments should narrow again.
