
Is the small cap effect in Switzerland a chimera?

Dr. René Dubacher
Financial Markets
With an outperformance of 65.12% over the past 5 years (3/31/2013-3/31/2018), domestic small cap stocks seem to once again confirm a widely known stock market experience, the small cap effect.
With an outperformance of 65.12% over the past 5 years (3/31/2013-3/31/2018), domestic small cap stocks seem to once again confirm a widely known stock market experience, the small cap effect.

Small Cap Effect in Switzerland: A Chimera?
In our December 2016 Navigator publication "Does the small cap effect exist?", we concluded that over longer periods of time, a small cap effect can only be observed for stocks at the lowest end of the market capitalization spectrum. By international standards, these are relatively illiquid micro caps. Therefore, the small cap premium in Switzerland might be more of an "illiquidity premium" after all.
Today we address the question: where exactly does the outperformance of small caps come from?
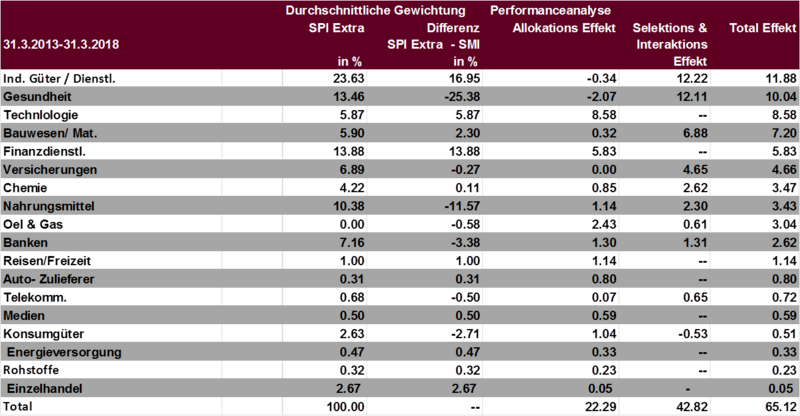
The following table shows the performance decomposition of the SPI Extra stock index versus the SMI. In finance jargon, this analysis is called attribution analysis according to Brinson et al. (1985). The procedure is to invest in all stocks of the SPI Extra according to the index weighting and to compare this portfolio with the Swiss Market Index (SMI) as benchmark.
Allocationsanalysis SPI Extra vs SMI
SPI Extra vs SMI
Over the period under review (31.3.2013-31.3.2018), the SPI Extra outperformed the SMI by 65.12%. Of this outperformance, 22.29% can be attributed to the allocation effect.
Of the handsome outperformance of the SPI Extra of 65.12%, 22.29% is explained by the allocation effect, i.e. the different weighting of the sectors in the two indices. In other words: If we had invested in the SMI with the sector weighting of the SPI Extra, the SMI performance would have been 22.29% higher. Thus, we can explain one third of the outperformance of the SPI Extra compared to the SMI with the different sector composition.
The remaining performance difference of 42.82% is explained by the different selection and weighting of the individual stocks. Two sectors are dominant: differences in the industrial and health care sectors explain another 24.33 percentage points of the relative performance difference. In the industrial sector, only ABB, SGS and Adecco are represented in the SMI, while the SPI Extra contains another 50 industrial stocks. These achieved a performance of 87.72% over the period, compared with 27.04% for the performance of the industrial stocks in the SMI.
With an average weight of 38.84%, the Health Care sector is overweighted by 25.38% in the SMI compared with the SPI Extra. In the SMI, these are the defensive pharmaceutical giants Roche and Novartis; in the SPI Extra, the high-growth medical technology dominates.
The last part of the performance difference can be attributed to the Technology sector of the SPI Extra, which has cumulatively returned 283.95% over the last 5 years. This sector is not even represented in the SMI.
Stock market wisdom is often only plausible narratives at first glance. Sometimes there are (coincidental) correspondences, sometimes not. Contrary to popular belief, our analysis, which is ultimately quite simple, shows that it is not the so-called small-cap effect that is responsible for the performance difference between the SPI Extra and the SMI, but that a significant part of the performance difference can be explained by the differences in sector weighting and the underperformance of the defensive healthcare sector.
