
BBB Bonds: Stable - Popular - (Over)Valued?

Financial Markets
A look at the historical development of the credit risk premium (i.e. the additional interest compared with government bonds for the risk of default due to bankruptcy) for European corporate bonds with an investment grade rating (AAA-BBB) shows that lower premiums were only paid in this millennium in the period directly before the major global financial crisis - i.e. 2004-2007. In 2014, 2017 and 2020, today's level was synonymous with bottoming out in each case.
A look at the historical development of the credit risk premium (i.e. the additional interest compared with government bonds for the risk of default due to bankruptcy) for European corporate bonds with an investment grade rating (AAA-BBB) shows that lower premiums were only paid in this millennium in the period directly before the major global financial crisis - i.e. 2004-2007. In 2014, 2017 and 2020, today's level was synonymous with bottoming out in each case.
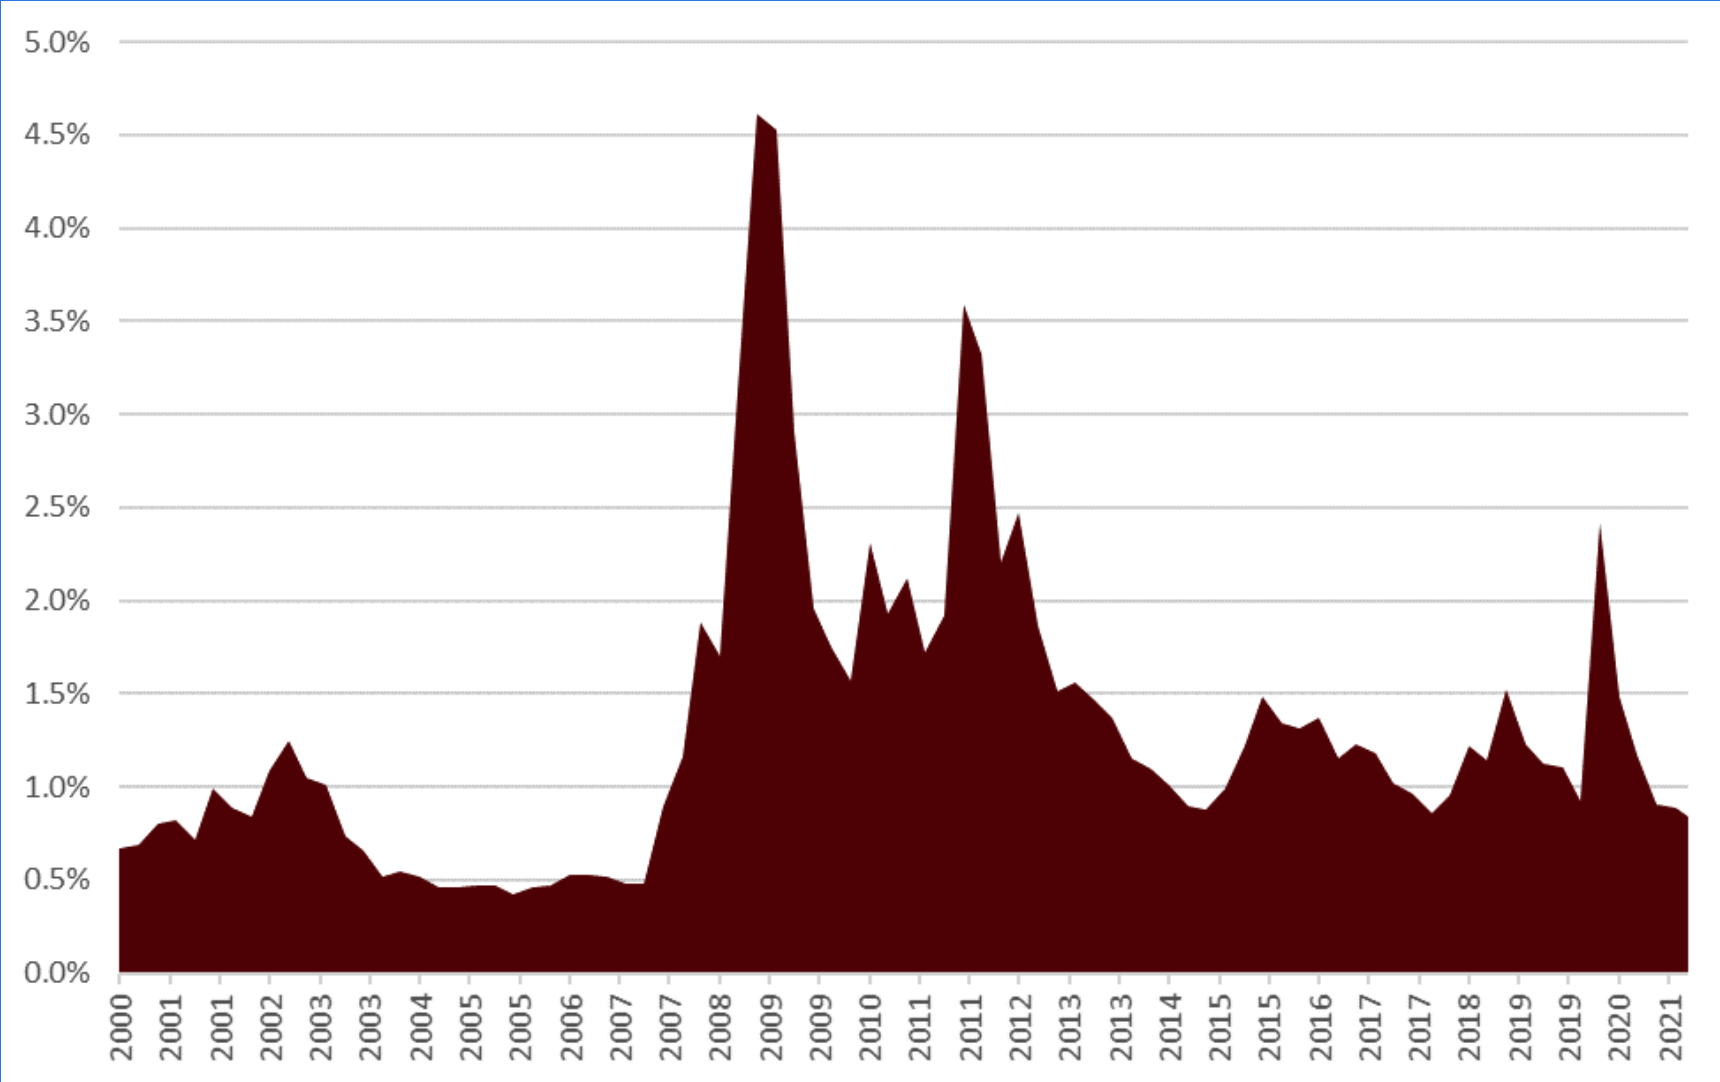
Chart: Credit risk premium for European corporate bonds (investment grade) in percentages
This appears to be the case in 2021 as well. After a steep rise at the beginning of the pandemic and a quick, strong recovery since the peak of the Corona crisis, credit spreads have settled at pre-crisis levels and have fallen to the 0.85% level (i.e. 85 basis points bp; 1 bp equals 1% of 1%) in recent days. Is this valuation justified ?
The absolute historical low of credit spreads in Europe this millennium was 0.4% or 40 bp and was reached in 2005.
However, a simple comparison with today falls short. Since the turn of the millennium, the distribution of debt ratings in Europe has changed massively. Companies with the top AAA rating have practically disappeared, but the proportion of companies in the lowest investment grade rating category, BBB, has increased sharply. Many companies have consciously decided that in this low interest rate environment, a higher leverage (ratio of debt to equity) and thus a lower rating is economically opportune. At the same time, many new debtors with low ratings found financing on the capital markets for the first time, not least thanks to the almost desperate search for yield on the financial markets. The historical development of the rating distribution in the European bond market is nicely illustrated below.

Chart: Historical development of the rating distribution of EUR corporate bonds
Where would the current average credit risk premium for EUR corporate bonds be if it were calculated with the current spreads but with the rating distribution of anno 2005 (i.e. just under half as many riskier BBB bonds as today in the index) ? This should make the 2005 rating more comparable to the current rating.
The answer is at about 70bp, so about 15bp lower than today, but still about 30bp away from the all-time low in 2005.
Not only are there many more companies with a BBB rating in today's index, the companies are on average even more indebted than in 2005, as the following chart shows:
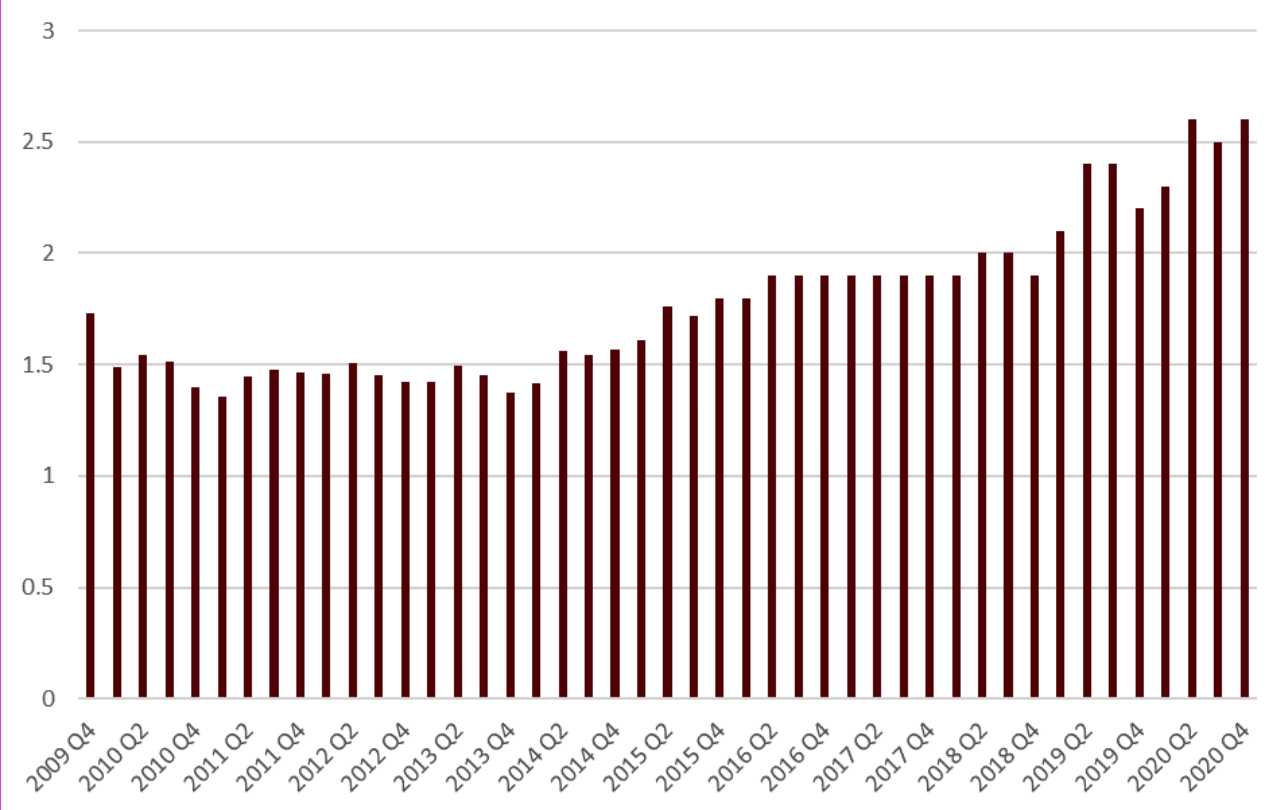
Chart: Historical development of leverage ratio (net debt to earnings before interest, taxes & amortization: "Net Debt to EBITDA") for EUR corporate bonds (excluding financials)
