
Beauty is in the eye of the beholder: Are stocks highly or lowly valued?

Dr. René Dubacher
Financial Markets
Financial markets reflect investors' expectations about the future; therefore, it is hardly surprising that they were chaotic in 2020. The resurgence of risky assets amid a fragile economy raises the question of whether bubbles have formed in certain assets or whether the ups and downs are explained by rapidly changing fundamental factors
Financial markets reflect investors' expectations about the future; therefore, it is hardly surprising that they were chaotic in 2020. The resurgence of risky assets amid a fragile economy raises the question of whether bubbles have formed in certain assets or whether the ups and downs are explained by rapidly changing fundamental factors
Even in a year when gains slumped, investors in the benchmark global stock market index, the S&P 500, earned 18.4%, more than double the typical return over the past 20 years. The Swiss stock market (SPI) also ended the year up 3.82%, with the Swiss franc appreciating more than 9% against the USD.
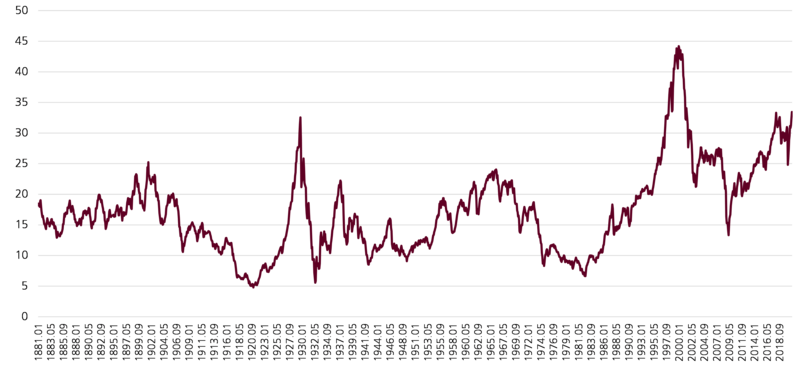
Share valuation with CAPE
Source: Data from Robert Shiller; own presentation
Kursgewinne haben die Bewertungskennzahlen an den Aktienmärkten in die Höhe getrieben. Eine solche Messgrösse ist das zyklisch bereinigte Kurs-Gewinn-Verhältnis oder «CAPE». Dabei werden die inflationsbereinigten Aktienkurse ins Verhältnis zum Zehnjahresdurchschnitt der realen Gewinne pro Aktie gesetzt (Graphik 1). Wenn das Verhältnis hoch ist, sind Aktien im Verhältnis zu ihren Gewinnen teuer; auf solche Perioden folgen in der Regel niedrige langfristige Renditen im nächsten Jahrzehnt. In Amerika lag das Verhältnis im Dezember 2020 bei 33 und damit über dem Niveau von Anfang des Jahres. Nur zweimal zuvor lag das Verhältnis in Amerika über 30 - in den späten 1920er Jahren und in den frühen 2000er Jahren. Die großen Tech-Firmen, von denen man erwartete, dass sie vom Online-Shopping und der Heimarbeit profitieren würden, haben eine überproportionale Rolle bei der Aktien-Rallye gespielt. Auf sie entfallen zwei Drittel der Gesamtrendite aus dem Halten des S&P 500.
Price gains have driven up valuation ratios on the stock markets. One such measure is the cyclically adjusted price/earnings ratio or "CAPE". This relates inflation-adjusted share prices to the ten-year average of real earnings per share (Chart 1). When the ratio is high, stocks are expensive relative to their earnings; such periods are usually followed by low long-term returns over the next decade. In America, the ratio was 33 in December 2020, up from earlier this year. Only twice before has the ratio in America been above 30 - in the late 1920s and the early 2000s. The big tech companies, which were expected to benefit from online shopping and work-at-home, have played a disproportionate role in the stock rally. They accounted for two-thirds of the total return from holding the S&P 500.
The same phenomenon was seen in China, where online shopping and tech giants Alibaba, Meituan, JD.com, Nio, Pinduoduo, which are grouped in the "MSCI China Consumer Discretionary Index," gained 76% from the start of the year to Nov. 6. The U.S. election and the Chinese government's intervention in ANT Group's planned IPO led to a violent sector rotation with losses of nearly 15%. Alibaba was hit the hardest with a loss of more than 20%. The icon of Internet commerce ends the year only just in the plus.
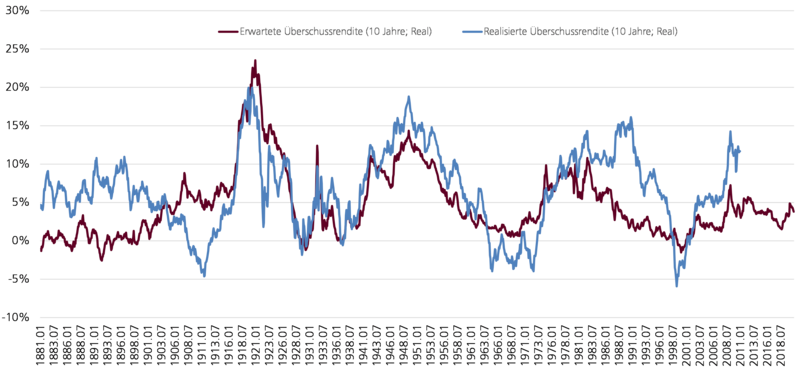
Expected excess return
Source: Data from Robert Shiller; own illustration.
As chart 2 shows, there is a strong correlation between the evolution of interest rates as well as the behavior of stock prices.
Viewed in isolation, the "CAPE" ratio ignores the impact of interest rates on valuations. The value of a company to its shareholders is equal to the present value of a company's future earnings. This means that stock prices are sensitive to 1.) changing expectations of future earnings, but 2.) also to the discount rate used to calculate what future earnings (discounted to) are worth today. This discount rate for stocks has changed tremendously. At the beginning of 2020, the yield on ten-year U.S. Treasury bonds was 1.8%. By mid-March, it was down to 0.6%. Since the announcement of successful Covid vaccines, yields have risen, to 1.1%.
To incorporate interest rate movements, Shiller publishes "excess yield" figures (Chart 2). This is calculated by inverting the "CAPE" ratio (i.e. one divided by CAPE, also known as "earnings yield"), from which an indication of the expected return on equities can be derived. Subsequently, the expected real returns for holding bonds are subtracted. Thanks to low interest rates and modest inflation expectations, real returns for the next decade are actually negative.
As chart 2 impressively shows, the expected excess return is higher than in January 2020. Put another way: Equities have become more attractive relative to bonds. Initially, probably because bond yields fell rapidly, making equities more attractive; more recently, equity prices are likely to have risen further thanks to the vaccine - heralding the return of growth and profits. This has not been offset by the modest rise in yields.
Yes, no geese are licking their chops: at 3.8% at year-end, the expected real excess return on equities for the next 10 years is well below the long-term realized historical average of 6.5%. But still: Compared to government bonds, the expected annual additional return (namely the equity market premium) is still almost 3%. Cumulated over 10 years, this results in an asset advantage over bonds of +35%.
In view of the reduction in discount rates, an increase in stock prices alone is not enough to indicate a bubble. Equity investments still appear to be an attractive asset class in this environment. Or, to put it in a nutshell: TINA ("There Is No Alternative").
