
Equity earnings performance Europe vs. USA

Dr. Martin Schlatter, CEFA
Financial Markets
The annual results of Apple, Microsoft or Amazon have positively surprised investors and the good results were also immediately acknowledged with new high prices. Not only these flagships of the US technology companies rush from record to record, but also the entire US stock market is happy about new highs of the indices such as the S&P 500 or the MSCI USA.
The annual results of Apple, Microsoft or Amazon have positively surprised investors and the good results were also immediately acknowledged with new high prices. Not only these flagships of the US technology companies rush from record to record, but also the entire US stock market is happy about new highs of the indices such as the S&P 500 or the MSCI USA.
Sector weights and earnings development in the USA and Europe
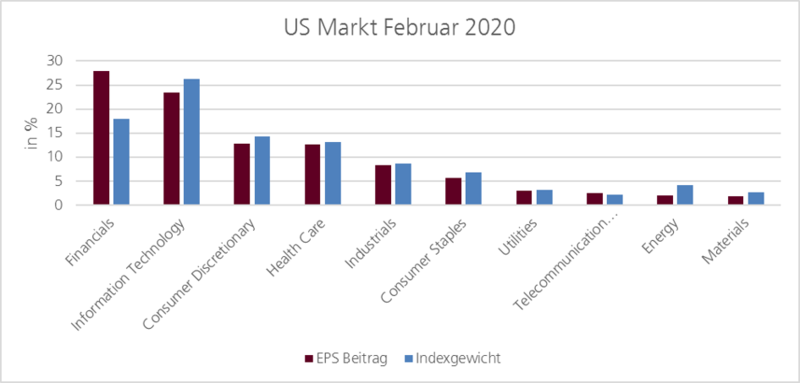
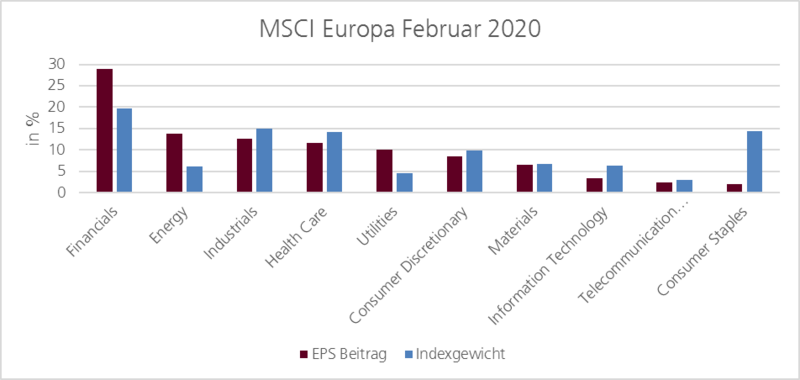
The valuation of the stock markets is driven to a large extent by the earnings generated by the companies. It is therefore worth taking a close look at these. In the following graphs, we have calculated the percentage shares of the various sectors in the total earnings of the companies over the last 12 months of the MSCI USA and the MSCI Europe. We compare this with the weight of the corresponding sector in the index.
Equity earnings performance Europe vs. USA
It is striking that the financial sector contributes the largest share of earnings in both markets, namely around 28% each. However, the weight of financial stocks is significantly lower in both markets, namely only 18% in the USA and 20% in Europe. This sector is an above-average contributor to earnings compared to its weight. The sector can be classified as favorable compared to the overall market.
Europe Sector weights EPS
In the USA, the technology sector is the second most important sector for earnings with 24%. However, with a weighting of over 25%, it is also more highly valued. In Europe, by contrast, the contribution of technology is currently less than 5%, making it one of the laggards.
In Europe, energy stocks, industrials and healthcare each contribute between 10-15% to earnings. Energy stocks in particular are a sector with a rather low valuation. The distribution of profit contributions is clearly different between the US and Europe. Peter Oppenheimer, head of global equity strategy and European macro research at Goldman Sachs, has calculated the effect of the different allocation. According to his calculation, the S&P 500 has increased earnings by 88% since the financial crisis. The European market, on the other hand, by only 4%. If Europe had the same sector weighting as the U.S., earnings would have increased by 53%.

Earnings growth various stock markets
Where does the remaining difference come from? Since the financial crisis, some U.S. companies have disappeared, while the others have repositioned themselves. The result is an impressive expansion of profits. The chart below shows the profit development for the three most important sectors, normalized as of September 2010. Overall, all sectors have grown with a relatively high consistency, whereby the financials certainly had the advantage that after the financial crisis, profits were very low across the sector. The tax reform of 2017, which led to an acceleration, is also clearly visible.

Earnings Growth USA
The combination of a good sector weighting and the stable earnings trend have justifiably caused the US market to rise significantly. The good performance is not coincidental.
What does this mean for the active investor? The US remains an attractive market. The future development depends very much on two sectors. Europe has catch-up potential and is therefore attractive for active managers. On the one hand, an active deviation from the passive market weighting should lead to a portfolio with more growth. Furthermore, in the selection of stocks, added value can also be achieved through the targeted selection of high-quality growth stocks.
