
With (investment) style through the crisis

Dr. Martin Schlatter, CEFA
Financial Markets
Our preferred approach to asset management is to apply scientific evidence. We try to be as objective and fact-based as possible to optimize the likelihood of success of our investment activities for clients.
Our preferred approach to asset management is to apply scientific evidence. We try to be as objective and fact-based as possible to optimize the likelihood of success of our investment activities for clients.
How To
"No Style works all the Time", but "Some style is always in Fashion"
The most important success factor in the management of equity assets is factor investing (also known as "style investing").
How do factor-based investment strategies actually behave during market downturns, as we saw most recently in March? Respectively, how could a portfolio be positioned to benefit as much as possible from a recovery?
The American analysis firm Style Analytics has written a detailed study on this. They have analyzed the last three major global market crashes (Black Monday 1987, bursting of the Tech Bubble, Global Financial Crisis "GFC") and found that the current crisis has the highest correlations with the Global Financial Crisis in terms of factor returns. However, the duration of the financial crisis was much longer than the current collapse since Covid-19, which recently crippled the global economy. During the Global Financial Crisis, the U.S. market lost about 50% in 16 months; in the current crisis, the S&P 500 lost about 34% from February 19 to March 23. Currently (end of April 20) we are back up 25% from the lows. The data for Europe or emerging markets looks similar. For further discussion, we will focus on Europe.
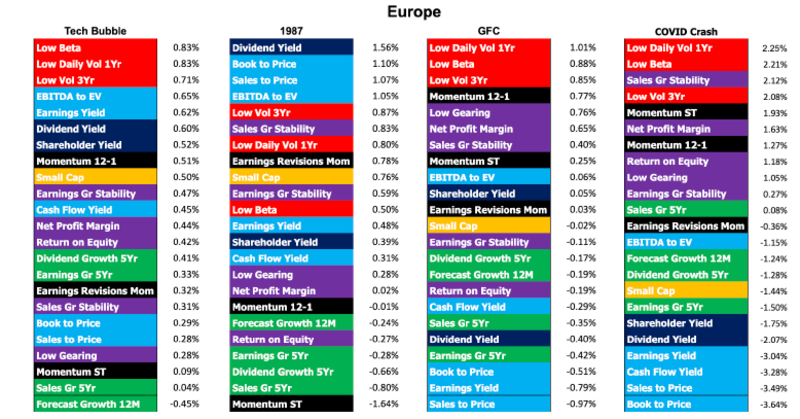
Style analysis of past market declines and the Covid crisis to the March low shows that typical substance ("value") and yield ("yield") factors, colored light blue and dark blue, underperform significantly, while factors focused on low volatility ("low vol") and balance sheet quality ("quality"), colored red and purple, outperform.
Style Investing
The chart shows the Style analysis of the past market slumps in Europe. The figures shown correspond to the respective return of the average monthly return of the factor portfolios during the slump. The different styles are differentiated by color: light blue: substance ("value"), dark blue: yield ("yield"), green: growth ("growth"), purple: quality ("quality"), yellow: market capitalization ("size"), red: low volatility ("low vol"), black: momentum ("momentum").
The same analysis is similar for US markets or emerging markets.
In summary, a portfolio should be invested in low volatility and high quality stocks during a crisis. Substantial stocks and small-capitalization stocks should be avoided.
Given the close similarity between the current crisis and the GFC, it is certainly interesting to ask how the factors have evolved in the recovery after the crisis.
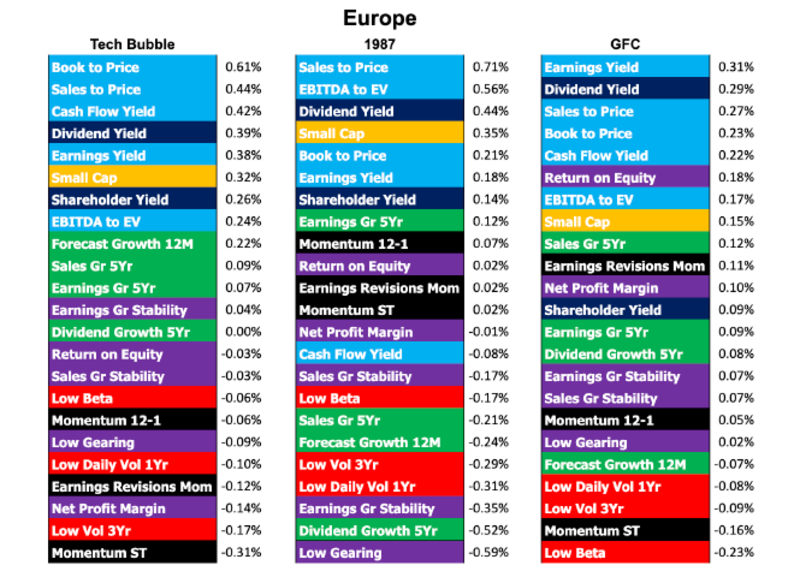
Style Investing post Crashes
Analogous to the first chart, again using Europe as an example, the returns of the factor strategies in the recovery phase are shown.
Not surprisingly, the picture turns around completely. The previous losers are among the winners during the recovery. Substantial and small capitalization stocks are the preferred style, while defensive stocks with deep risk are among the losers. But there are differences in the extent of returns. The return differential between the best and worst styles during the GFC was about 2% per month. Since a recovery usually lasts longer (than the correction), the post-GFC returns and return differentials between the various styles are smaller, in the range of 0.5%.
Because of the close similarity to the GFC, we analyzed how our European factor model reacted in the recovery after the financial crisis. Since many financial stocks increasingly took on the character of substance stocks (typically low price/book ratios) during the GFC, substance showed a clear underperformance until February 2009. Only then did a clear recovery set in. In the European model, substance stocks were underweighted due to the style allocation. This was helpful until February 09, but led to underperformance thereafter, as can be seen in the following chart. At its maximum (August 09) the underperformance was around 2.8%. Thanks to the dynamic adjustment of our style allocation, plus an above-average stock selection, the underperformance was made up by the beginning of 2010 and a clear outperformance of over 5% was achieved again by the end of 2010.
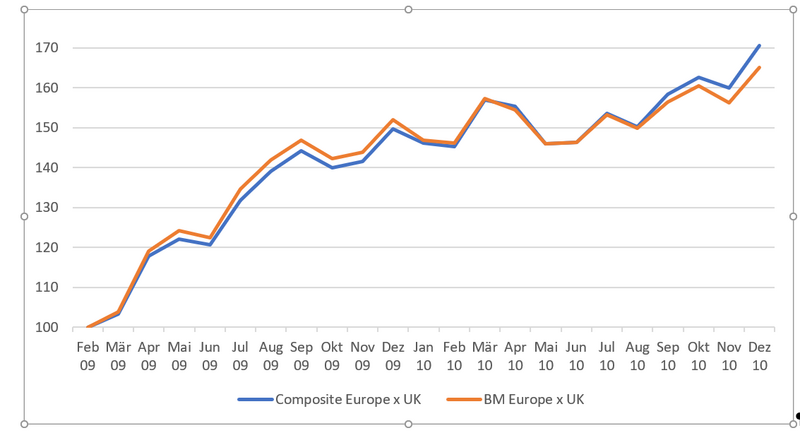
Factor Strategies in Europe
After a strong trend reversal (February 2009), it is not entirely untypical that factor models initially underperform before momentum factors in particular pick up the new momentum and improve performance results.
What can be deduced from the past crises for the current situation in Europe:
- Due to the violent rotation of style returns after crises, a (too) dynamic reallocation is associated with great risks and is not recommended. Sticking to a static and balanced allocation over the whole cycle is not disadvantageous. In particular, the reduction of substance and small capitalization could lead to a significant lower return after the crisis
- The deeper return differentials in the recovery give the active allocation more time to make post-crisis adjustments. However, it is important to keep in mind that the initial countermovement is usually very sharp; this carries the risk of pronounced relative losses
- If smaller adjustments are made, much attention must be paid to risk management. Sector and style deviations must be consciously reviewed.
Based on these findings, our current style positioning for European equities is not very pronounced. A slight overweight to Growth/Momentum and Low Vol/High Quality is in place.
