
MSCI ESG Leaders Index

Dr. Martin Schlatter, CEFA
Financial Markets
Every asset manager, portfolio manager or investment advisor is currently confronted with the three magic letters ESG. Many clients want to know what impact the integration of ESG criteria has on their investments.
Every asset manager, portfolio manager or investment advisor is currently confronted with the three magic letters ESG. Many clients want to know what impact the integration of ESG criteria has on their investments.
The European regulators have also taken up the issue with new reporting requirements.
For us, this is the right moment to take a closer look at a popular ESG index. For this purpose, we would like to compare the MSCI Equity World ESG Leaders Index with the conventional MSCI Equity World Index. The MSCI ESG Leaders Index focuses on the leading companies in terms of ESG. MSCI rates each company on its Environmental, Social and Governance performance. The higher the rating, the better the company is positioned in terms of ESG. The MSCI Leaders Index includes the top 50% of companies per industry.
While the MSCI World Index includes around 1560 companies, the Leaders Index includes only 725. So a clear selection. What about the return of these two indices?
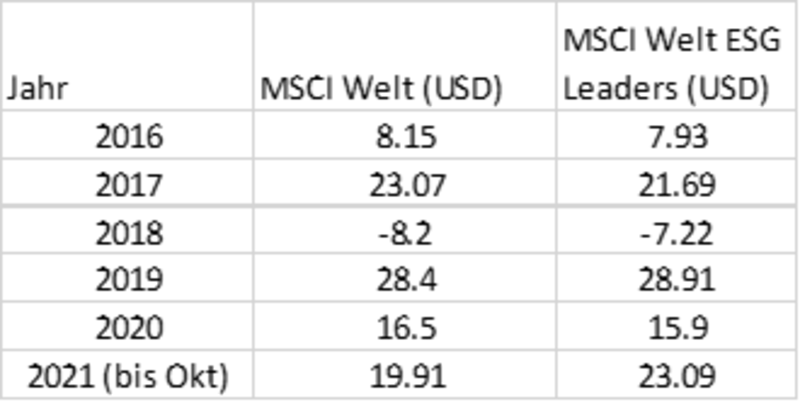
MSCI Leaders Index vs MSCI Welt
Over the last few years, the indices have developed very similarly; in 2021, the Leaders Index clearly has the better return.
Where does this return come from?
Is it because ESG stocks generally perform better, does it have to do with the right choice of sectors, or is it a stock-specific result that has come about more by chance.
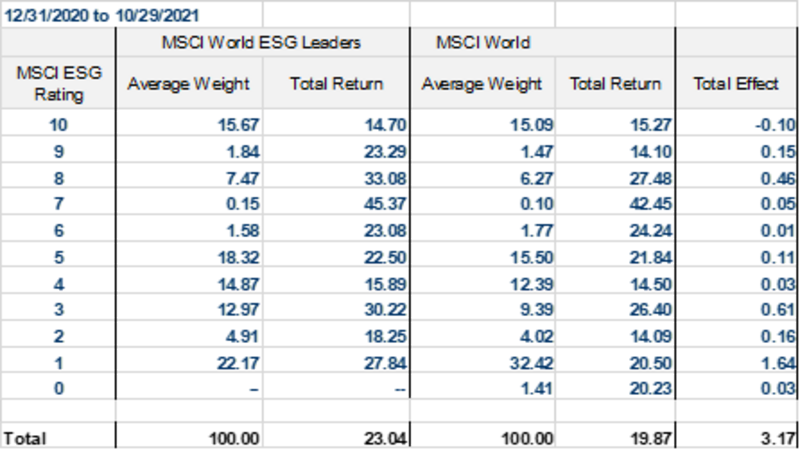
ESG Rating Classes: MSCI ESG Leaders Index vs. MSCI World
The table shows the breakdown of the return in 2021 by various rating classes. For each rating, both the average weighting and the return achieved are shown. The last column shows the added value generated for the individual ratings.
It is interesting to note that more than half of the added value was generated by the lowest ratings. Not only was rating class 1 significantly underweighted in the Leaders Index, the right stocks were also selected. In this class, Google is responsible for the good performance. Despite the poor ESG rating, Google is double weighted in the Leaders Index and has contributed almost 1% to the additional return. Google is in the Leaders Index because the stock is dominant in its sector in terms of weighting. The rest of the added value in rating class 1 is due to Amazon. However, this stock has been excluded from the Leaders Index.
Conversely, it is disappointing that no major added value was achieved in the good rating classes. Only in rating class 8 was a single stock again able to secure virtually all of the added value: Nvidia. The manufacturer of graphics cards achieved a return of almost 100% and is overweighted in the Leaders Index.
What does this little analysis show us? The significantly better return in 2021 of the Leaders Index was caused by a few stocks. We did not see an over-return of the higher ranked ESG stocks. Also the underweighting of the worst performing stocks added only limited value (Amazon). The apparent better return of the Leaders Index is due to higher stock risks. The exciting question that remains open: Will similar title effects have such a positive effect again next year?
