
US wage growth largely explainable

Dr. Roman von Ah
Economics
Subdued U.S. Wage Growth Despite Full Employment: Anomaly or New Normal?
Subdued U.S. Wage Growth Despite Full Employment: Anomaly or New Normal?
U.S. GDP is growing at a robust 2.2% p.a., driven mainly by consumption and investment spending. The unemployment rate is approaching historic lows. Nevertheless, hourly wages are growing only moderately, as the following chart shows:
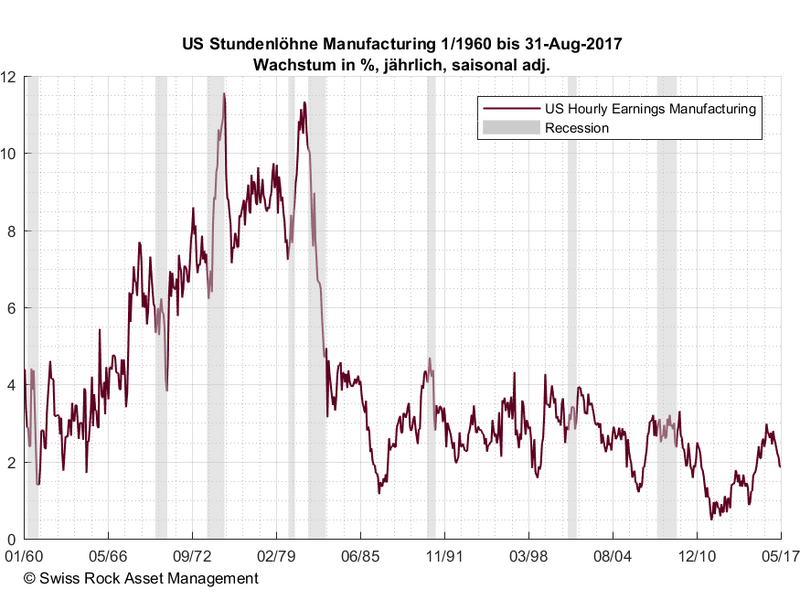
US wage growth in manufacturing
Much ink has already flowed on the subject of U.S. wages, which are not really rising despite robust growth. The culprits are typically identified as globalization, nefarious international companies producing in low-wage countries, and money-hungry corporate owners who don't begrudge employees the fruits of their efforts.
Economists at the San Francisco branch of the Fed recently explored this question and - only at first glance - came up with some surprising findings (Daly et. al, What's up with wage growth, FRBSF Economic Letter 2016 and American Economic Review 2017).
Publicly discussed indicators (such as the chart above) are highly-aggregated statistical surveys. They are average figures and their dynamics over time. When these statistics are broken down into their component parts, which is called dis-aggregation into the elements of full-time workers, median earnings, and entries/exits to the labor market, the picture brightens considerably, as the following chart shows:
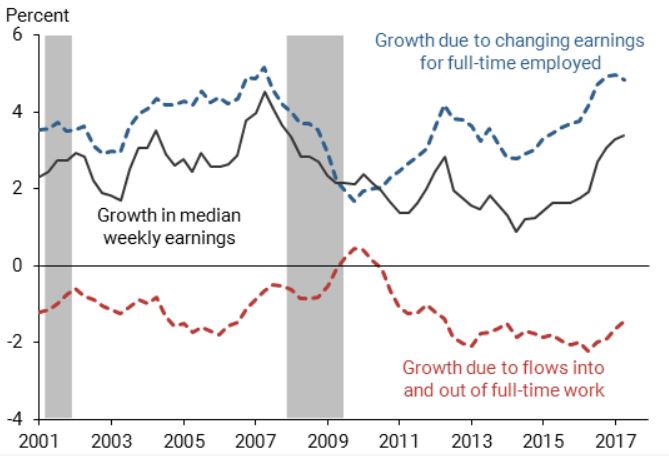
Disaggregation of hourly wages
Wage growth for full-time employees (blue line) after the weak recession in 2001 developed from around 3% to 5%. From 2007, this growth dropped to 2% in the environment of the great financial crisis. Since then, wage growth has increased to over 4%. If we take median wages (median income, black line), growth is in the 3% range.
While full-time employees make up the majority of workers, they are just not the entirety. Median income also includes those employees who are new to the labor market, such as school leavers or second earners in families. Newly entering workers, whether from school, or from a situation of voluntary or involuntary (part-time) unemployment, earn below-average wages. Strong growth in job openings can initially lower average wages as well as wage growth rates, as shown by the red line as a negative contributor to wage growth.
This is exactly what has happened. In parallel with higher economic growth, many workers have (re)integrated into the workforce; lower starting wages have pulled down average wages. Baby boomers, who have been entering retirement age in greater numbers for several years, have significantly amplified this effect. Older workers typically have wages that are higher than average wages in their final years of employment. This is an indication, by the way, that experience does count.
Recently, the negative contributions of entries/exits into the labor market to the published wage growth rates have diminished. It is quite possible that wage growth will also become visible in the aggregate time series in the coming quarters.