
US Aktien im Wettstreit mit dem Rest der Welt

Dr. René Dubacher
Finanzmärkte
Zurück zur Übersicht
Nächster Beitrag
U.S. stocks reached a relative high last week compared to the rest of the world. Positive earnings outlook from U.S. blue-chip tech companies and a Corona virus-induced exodus from Asian stocks, were key contributors. The S&P 500 index is up 3% this year despite recent weakness, while the rest of the world is up between 1% and 2%.
U.S. stocks reached a relative high last week compared to the rest of the world. Positive earnings outlook from U.S. blue-chip tech companies and a Corona virus-induced exodus from Asian stocks, were key contributors. The S&P 500 index is up 3% this year despite recent weakness, while the rest of the world is up between 1% and 2%.
The following chart shows the performance of the S&P 500 versus MSCI World excluding USA
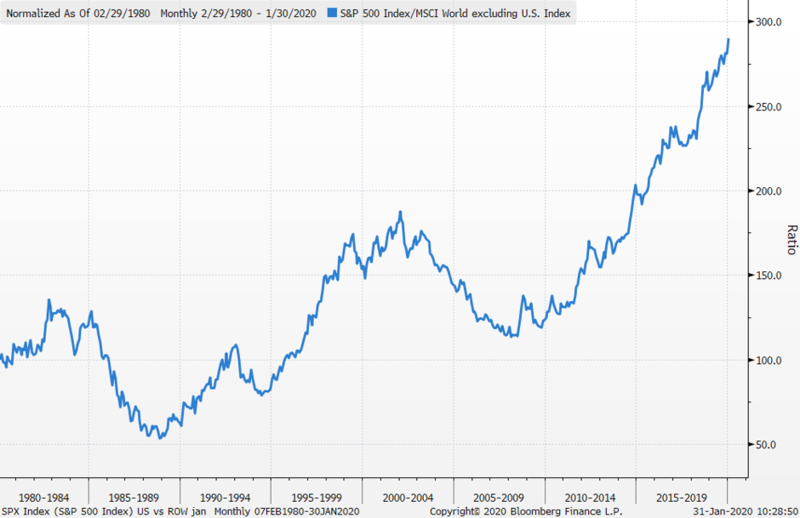
Performance S&P500 ggü. Aktien Welt ex USA
Looking at the graph, the question arises whether we are in a similar situation to 1999/2000. Then, as now, it was US technology companies that achieved very high valuations. The high valuation - late in a business cycle - is accompanied by a marked outperformance of growth stocks ("Growth") compared with substance stocks ("Value"); here, too, the values seem to be comparable with 1999/2000.
The following chart shows the underperformance of value stocks compared with growth stocks, which is also referred to as "drawdown".
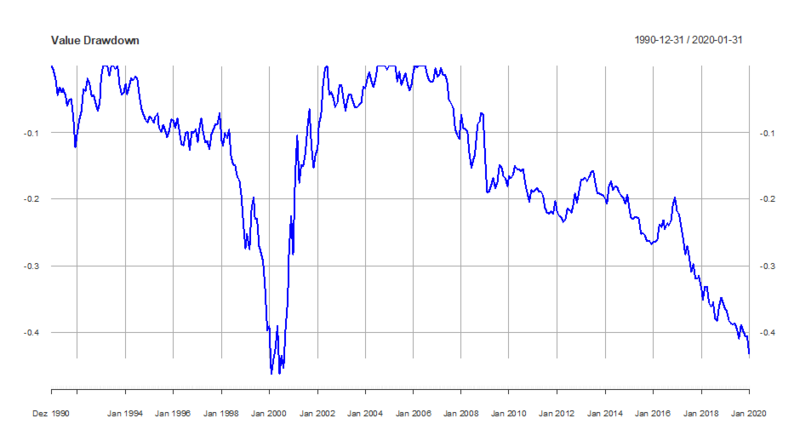
Substanzwerte ggü. Wachstumswerte
Although the "party mood" resembles the euphoria of 1999, there are significant differences. Of course, stocks are expensive and the S&P 500, at 22 times expected earnings, is at its highest level since the last crisis. But the levels were higher in 1999. At that time, the S&P reached 30 times value and the most expensive stock at the time (Microsoft) even reached 60 times earnings.
Skeptics will point to the S&P 500's price/sales ratio and enterprise value/cash flow multiples, which are indeed back at levels last seen in 2000. The reason they are higher than the earnings-based multiples is that companies have higher profit margins (in part because of the mix of companies in the index) and interest rates and taxes are structurally lower.
As reassuring as it may be that the market is not as overvalued today and credit markets are not as unstable as they were 20 years ago, at the same time, that tells us little. We may never return to such wild market conditions as we experienced then. We would hope so, because for those of you who have forgotten, back then the Nasdaq - after peaking in March 2000 - fell 75% in 2 years.
So simply noting that stock valuations are not as extreme as they were in 1999 does not protect today's market from a stiff correction. But it does argue against the idea of irrational overheating and, as a result, a meltdown in the financial markets.
